


Read a Story
A StoryMap is an interactive way to tell stories with maps. It combines text, images, videos, and data to show how people and places are connected. Instead of just reading about an issue, you can explore it spatially — seeing where events happen and how they relate to the environment around us. StoryMaps make complex topics visual, engaging, and easy to understand.

Filters
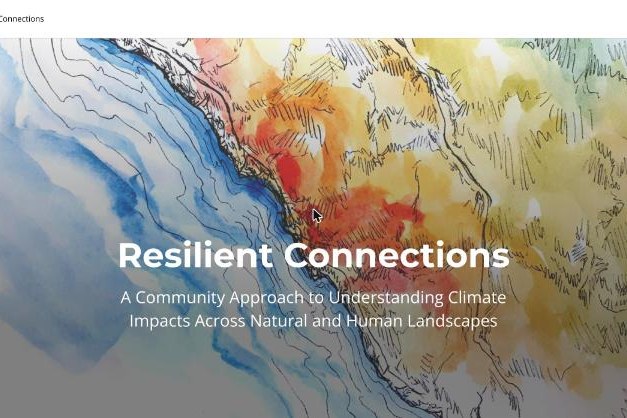
Resilient Connections (Connecting Wildlands & Communities)
A Southern California look at fire risk, changing watersheds, and threatened wildlife corridors, from a partnership including San Diego State University and the Climate Science Alliance.
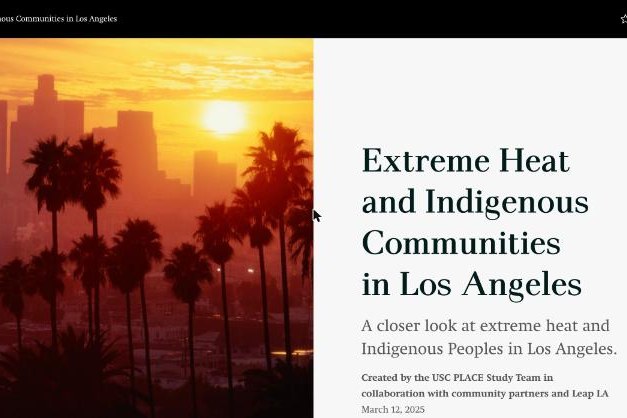
Extreme Heat and Indigenous Communities in Los Angeles (USC PLACE Study)
Traditional land maps and Indigenous Peoples’ relationship with extreme heat in what is now Los Angeles County.
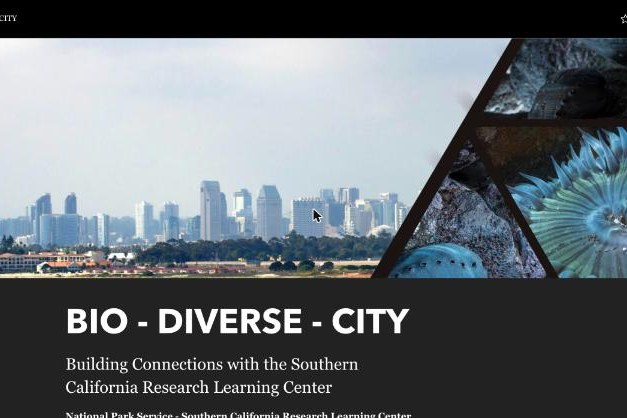
BIO-DIVERSE-CITY (NPS Southern California Research Learning Center)
How the National Park Service’s Southern California Research Learning Center studies and protects biodiversity from the mountains to the coast.
Exposing the Desert II: The Salton Sea (UC Riverside)
UC Riverside research on dust, environmental exposures, and health around the Salton Sea, including community-led research. Available in Spanish.
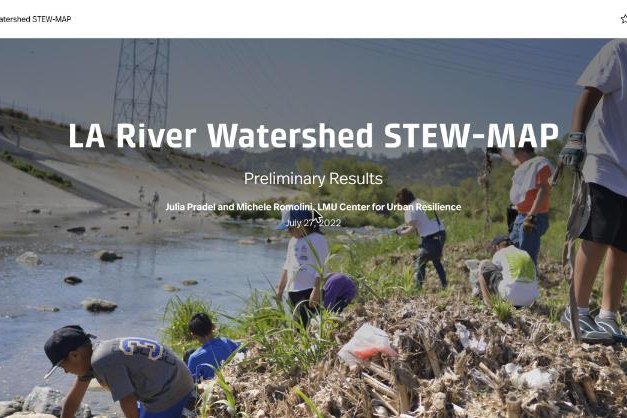
LA River Watershed STEW-MAP (LMU Center for Urban Resilience)
Maps the groups that care for land and water in the LA River watershed, from a national US Forest Service research program.
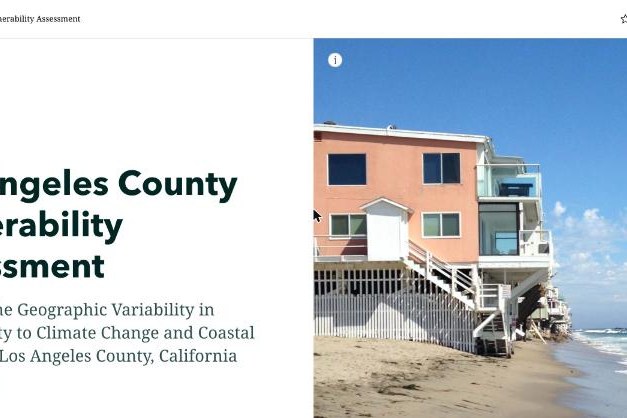
Los Angeles County Vulnerability Assessment (USC Sea Grant)
Maps how vulnerability to climate change and coastal hazards varies across LA County.
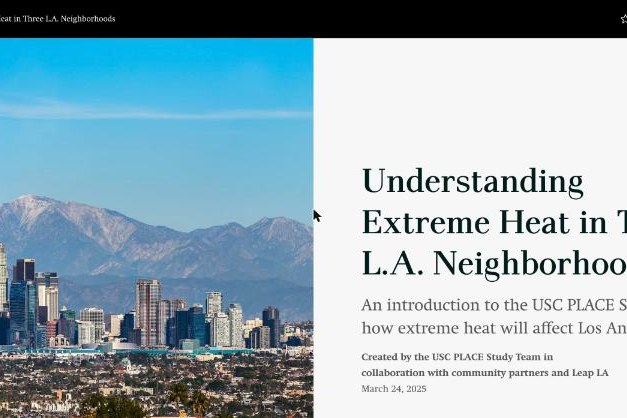
Understanding Extreme Heat in Three L.A. Neighborhoods (USC PLACE Study)
An introduction to the USC PLACE study, made with community partners, on how extreme heat will hit three LA neighborhoods.
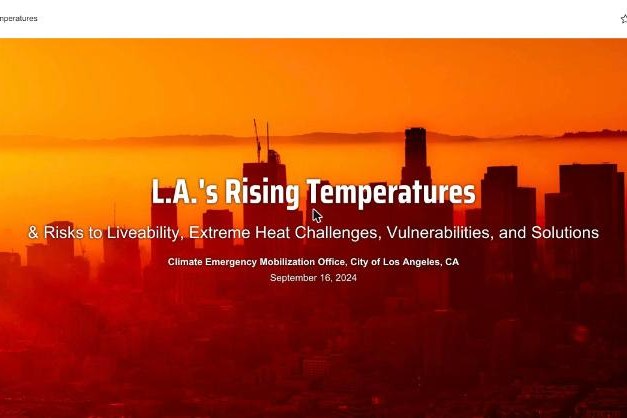
L.A.’s Rising Temperatures (City of LA & USC)
From the City of LA Climate Emergency Mobilization Office and USC: why extreme heat is LA’s deadliest climate risk, who is most exposed, and how to cool the city down.
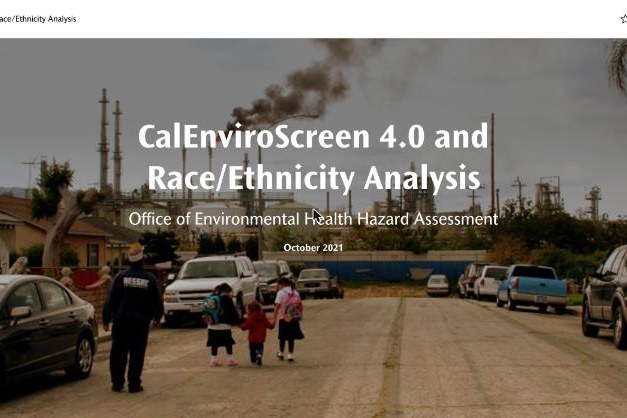
CalEnviroScreen 4.0 and Race/Ethnicity Analysis (OEHHA)
OEHHA’s analysis of how pollution burden in CalEnviroScreen 4.0 lines up with race and ethnicity across California.